Lecture 1 Multivariable Functions
Text References: Course notes pp. 1-10 & Rogawski 14.1-14.3
1.1 Learning Objectives
- Given a function of two or more variables, compute output values and determine its domain and range.
- Use level curves/surfaces and cross-sections to build the graph of a multivariable function.
1.2 Scalar Fields
This course is all about scalar fields which are functions that take input from \(\mathbb{R}^n\) and output a real number.
Exercise 1.1 Which of the following are scalar fields?
- \(f(x,y)=\sqrt{xy}\) is a scalar field since it takes input from \(\mathbb{R}^2\) and outputs a real number
- \(g(x,y,z)= \dfrac{xy-z}{z-2}\) is a scalar field since it takes input from \(\mathbb{R}^3\) and outputs a real number
- \(h(x,y) = (x-y, 2x^2+xy - y^2)\) is NOT a scalar field since it outputs a tuple in \(\mathbb{R}^2\)
Notice that the domain of a scalar field will be a subset of \(\mathbb{R}^n\) and that the range will be a subset of \(\mathbb{R}\).
Exercise 1.2 Calculate the value of the function at the given point and find its domain and range.
- \(f(x,y)=\sqrt{xy}\) at \((x,y)=(-1, -1/2)\)
- Value: We have \(f(-1, -1/2)=\sqrt{(-1)(-1/2)}=\sqrt{1/2}=1/4\)
- Domain: Since we are taking square roots, it must be that \(xy \geq 0\). This occurs if \(x\geq 0\) and \(y\geq 0\) or if \(x\leq0\) and \(y\leq 0\).
- Range: Note that the square root function can only output non-negative values. For any non-negative number \(k\), we can obtain \(k\) using \(f(k^2,1) = \sqrt{k^2}=|k|=k\)
- \(g(x,y,z)= \dfrac{xy-z}{z-2}\) at \((x,y,z)=(-1,5,4)\)
- Value: We have \(g(-1,5,4)=\dfrac{(-1)(5)-4}{4-2}=-\dfrac{9}{2}\)
- Domain: Looking at the denominator, it must be that \(z-2 \neq 0\) and hence \(z \neq 2\). The domain is the set of points \(\{(x,y,z)\in\mathbb{R}^3\mid z\neq 2\}\)
- Range: Any real number \(k\) can be obtained by taking \ \(g(k+3, 1, 3) = \dfrac{(k+3)(1)-3}{3-2}=\dfrac{k+3-3}{1}=k\). Therefore the range is \(\mathbb{R}.\)
1.3 Graphs of Scalar Fields
What do graphs of scalar fields look like? Well, if the function is of the form \(z=f(x,y)\), we can plot the set of points \((x,y, f(x,y))\) in \(\mathbb{R}^3\). The resulting surface is called the graph of \(f\).
Below is the graph of the function \(f(x,y)=\sqrt{xy}\). You can access an interactive version here: https://www.geogebra.org/m/yrvk6zwv
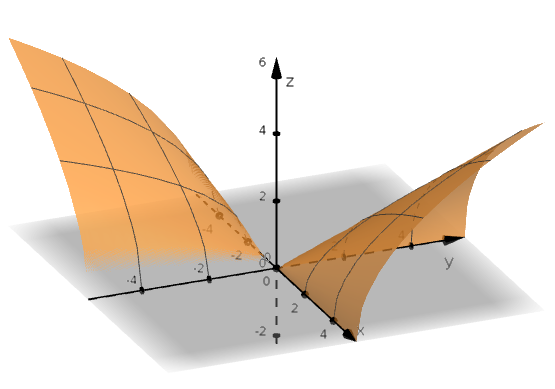
Figure 1.1: Graph of \(f(x,y)=\sqrt{xy}\)
Unfortunately, adding in just one more variable to the function means that we can no longer graph it. If the function were of the form \(w=f(x,y,z)\), the graph would be the set of points \((x,y,z,f(x,y,z))\) which forms a hypersurface in \(\mathbb{R}^4\).
Given a function of two variables (and in the absence of graphing tools) we build up an image of its graph using level curves and cross-sections.
Level curves intersect the graph of the function with the plane \(z=k\) for values of \(k\) in the range of the function. Plotting a set of level curves gives us a contour plot of the function. We generate this plot by setting \(f(x,y)=k\) for a few values of \(k\).
Cross-sections are formed by taking the intersection of \(z=f(x,y)\) with \(x= c\) for a few values of \(c\) and/or by taking the intersection of \(z=f(x,y)\) with \(y= d\) for a few values of \(d\). To make our lives easier, we typically choose \(c=d=0\).
Exercise 1.3 Now it’s your turn to have some fun! Choose one of the following functions:
- \(f(x,y) = -3x+y+7\) (mild)
- \(g(x,y)=x^2+4y^2\) (medium)
- \(h(x,y)=3x^2-y^2\) (spicy)
- Determine the domain and range of your function.
- Find a few level curves by setting \(f(x,y)=k\), \(g(x,y)=k\), or \(h(x,y)=k\) for at least 4 different values of \(k\). Sketch your level curves below (be sure to label your axes!).
- Sketch the cross-section \(x=0\) below (be sure to label your axes!).
- Sketch the cross-section \(y=0\) below (be sure to label your axes!).
- Based on your level curves and cross-sections, try to sketch the function. You can check all of your answers using the following interactive applet.
Solution. Solution for \(f(x,y)=-3x+y+7\)
The domain is \(\mathbb{R}^2\) and the range is \(\mathbb{R}\)
Note that we can choose any real value of \(k\) since the range of \(f\) is \(\mathbb{R}\). We have \(-3x+y+7=k\). Rearranging, we find \(y=3x+(k-7)\) which is the equation of a line with slope \(3\) and intercept \(k-7\). Choosing \(k=-1,0,1,2\) we have the family of lines \(y=3x-8\), \(y=3x-7\), \(y=3x-6\), and \(y=3x-5\).
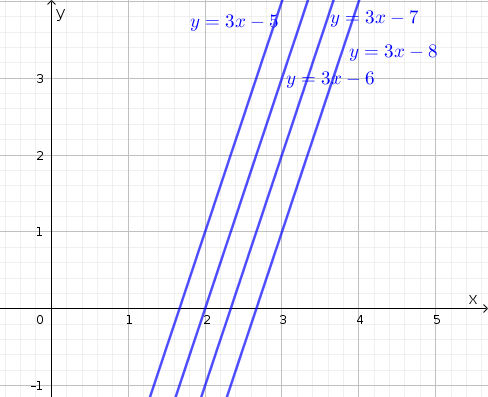
Figure 1.2: Level curves of \(f(x,y)=-3x+y+7\)
- Setting \(x=0\) we have \(f(0,y)=y+7\). Note that this cross-section is in the \(yz\)-plane.
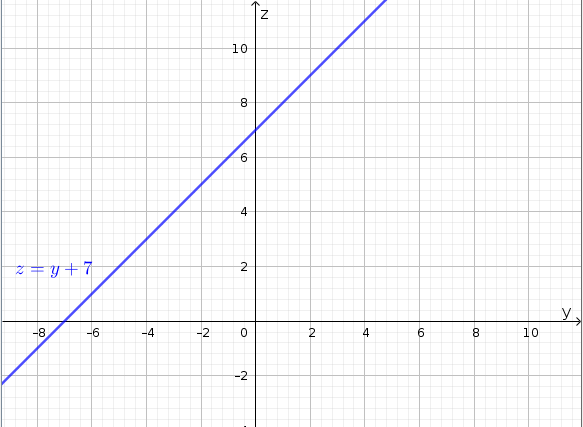
Figure 1.3: \(x=0\) cross-section of \(f(x,y)=-3x+y+7\)
Setting \(y=0\) we have \(f(x,0)=-3x+7\). Note that this cross-section is in the \(xz\)-plane.
See GeoGebra above.
Solution. Solution for \(g(x,y)=x^2+4y^2\)
The domain is \(\mathbb{R}^2\) and the range is non-negative real numbers (note the sum of squares).
Note that we must choose \(k\geq 0\) since the range of \(g\) the set of non-negative numbers. We have \(x^2+4y^2=k\), which is the equation of an ellipse. Choosing \(k=0,1,2,3\) we have the family of ellipses \(x^2+4y^2=0\), \(x^2+4y^2=1\), \(x^2+4y^2=2\), and \(x^2+4y^2=3\).
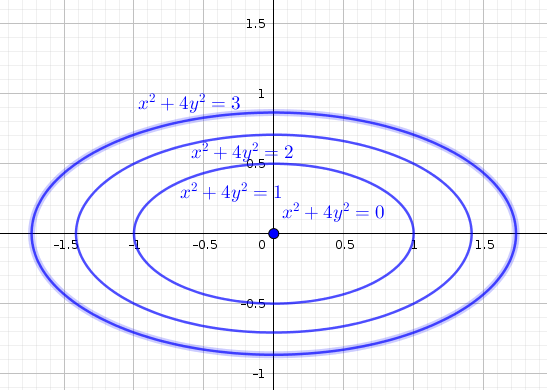
Figure 1.4: Level curves of \(f(x,y)=x^2+4y^2\)
- Setting \(x=0\) we have \(g(0,y)=4y^2\). Note that this cross-section is in the \(yz\)-plane.
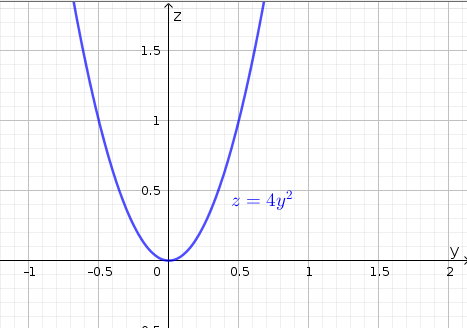
Figure 1.5: \(x=0\) cross-section of \(f(x,y)=x^2+4y^2\)
- Setting \(y=0\) we have \(g(x,0)=x^2\). Note that this cross-section is in the \(xz\)-plane.
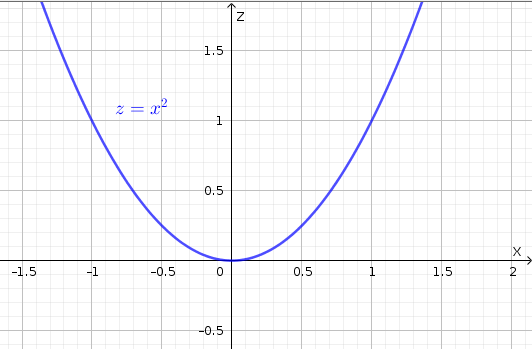
Figure 1.6: \(y=0\) cross-section of \(f(x,y)=x^2+4y^2\)
- See GeoGebra above.
Solution. Solution for \(h(x,y)=3x^2-y^2\)
The domain is \(\mathbb{R}^2\) and the range \(\mathbb{R}\).
Note that we can choose any real value of \(k\) since the range of \(h\) is \(\mathbb{R}\). We have \(3x^2-y^2=k\), which is the equation of a hyperbola. Choosing \(k=-1,0,1,2\) we have the family of hyperbolae \(3x^2-y^2=-1\), \(3x^2-y^2=0\), \(3x^2-y^2=1\), and \(3x^2-y^2=2\).
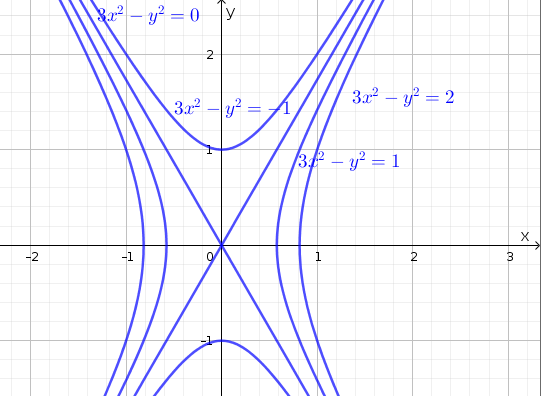
Figure 1.7: Level curves of \(f(x,y)=3x^2-y^2\)
- Setting \(x=0\) we have \(h(0,y)=-y^2\). Note that this cross-section is in the \(yz\)-plane.
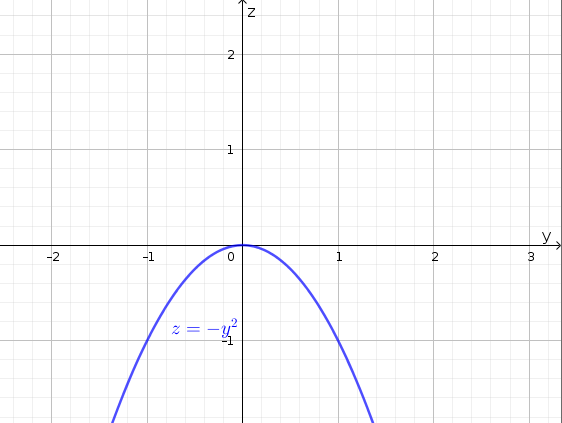
Figure 1.8: \(x=0\) cross-section of \(f(x,y)=3x^2-y^2\)
- Setting \(y=0\) we have \(h(x,0)=3x^2\). Note that this cross-section is in the \(xz\)-plane.
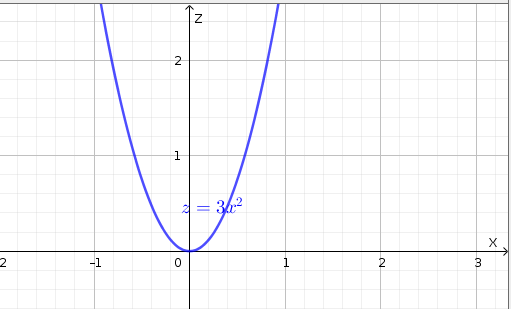
Figure 1.9: \(y=0\) cross-section of \(f(x,y)=3x^2-y^2\)
- See GeoGebra above.